Systematic Credit and Equity G-255 Trading Indicators for February 18, 2026
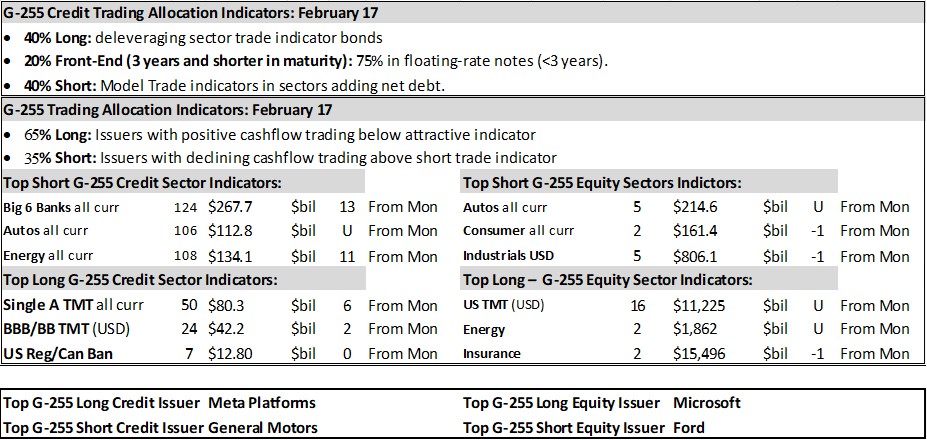
G-255 Specific Credit Sector Indicators February 18 – Long Only Indicators on Page 8
Understanding the G-255 Systematic Trading Model
G-255 is a fully automated, quantitative model that generates long and short signals for bonds and stocks of these major issuers. It uses only each company's own historical data—pricing, balance sheets, earnings momentum, and leverage—for objective, probability-based assessments with zero human input. Back-tested over 35 years, it delivers high tracking accuracy by focusing purely on issuer-specific facts, avoiding peers, macro, or sentiment
Long Opportunities
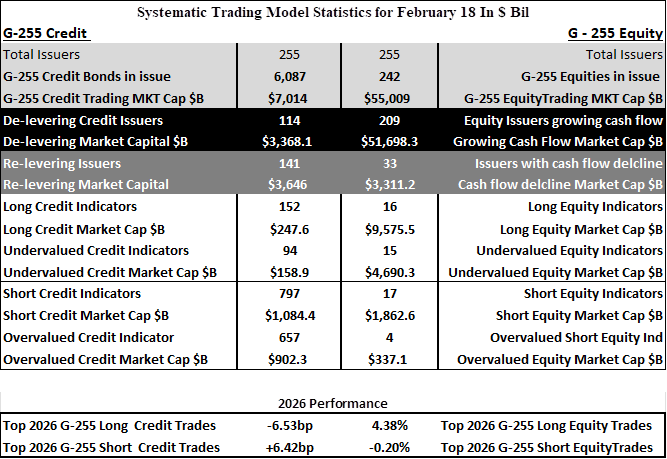
Credit: Focus on de-leveraging issuers — Single A/BB TMT, Single A Healthcare, UK/US/Canadian Banks, Floating Rate Notes (246 undervalued bonds worth $406.5 bil in value; 152 long trade indicators).
Equity: Focus YoY operating cash flow growth — TMT, Healthcare, Consumer (31 undervalued equities worth $14.266T).
Short Opportunities
· Credit: 1,454 overvalued bonds ($2.6T market value; 797 short indicators)
· Equity: 21 overvalued issuers ($2.465T; 17 short indicators).
The G-255 credit/equity systematic process provides 6,200 hourly trade indicators based on corporate capital
Structure pricing extremes.
G-255 Systematic Portfolio Daily Credit Trading Model Indicators
· Long Indicators: Are de-leveraging issuers with attractive valuations as well new supply of G-255 issuers
· Short Indicators: Are re-leveraging issuers trading within 10% of their 52 week tight credit spread.
· Replace Longs: Swap long positions that have reached their avoid trading level.
· New Supply: The G-255 trading model creates new issue long trade indicators for all new USD sold by G-255 issuers.
· Current Status of Trading Indicators: last week, 2 short trades reached their value trading level, and 2 new short trade indicators were added.
Monitor Trade Position Composition.
· Replace long positions that have reached their avoid trading level.
· Review: The G-255 credit trading model reassess portfolio trade % after weekly fund flow data to ensure alignment with the systematic strategy.
· Look for individual bond indicators to change overnight: Historic trading levels are leading to overnight adjustments to long, short, and avoid indicator levels.
G-255 Specific Bond Trading Indicators February 18
· Closed Positions: On 1/20/26 Royal Bank of Canada (A1/A) RY 4.305 11/03/31 reached its avoid trading level. On 1/21/26 Mitsubishi Finance (A1/A-) MUFG Float 09/12/31 and ATT (Baa2/BBB) T 4.55 11/01/32 both reached their avoid trading levels. On 1/30 Morgan Stanley (Baa1/BBB+) MS 5.498 1/19/38 (subordinated short) reached its avoid trading level. On 2/9 Williams (Baa2/BBB+) WMB 4.65 08/15/32 reached its avoid trading level. On 2/10 Toyota (A1/A+) TOYOTA 4.8 1/5/34 (short) reached its avoid trading level.
· Enter New Longs: 1/14/26 Bank of New York (Aa3/A+) BK 4.026 01/22/30, 1/27/26 RBC (Baa2) RY 6 ½ 05/24/2086, 2/03/26 Deutsche Bank New York (Baa1/BBB) were added as new issue long trade indicators.
· Enter New Short Trades: On 2/9/26 Oracle (Baa2/BBB) ORCL 5.7 02/04/36 was added as a short trade indicator
1
Tuesday: The Trading Model add the Barclays PLC Float 05/24/30 New Issue
Current Sample Systematic Basket Credit/Equity trades based on trading strategy February 17
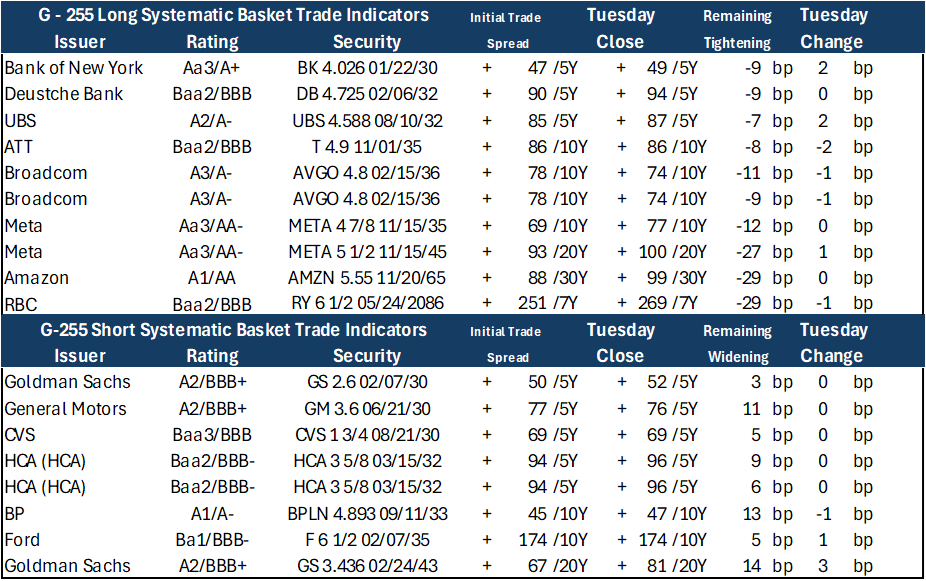
Systematic Long/Short Basket Trade Performance Report (January 4, 2025 – February 17, 2026)
· Total Trades: 195 (full year 2025); 30 (2026 YTD)
· Long Indicators (2025): 136 out of 150 tightened by an average of -9.2 bp. (2026): 8 out of 18 tightened by an average of -6.53 bp.
· Short Indicators (2025): 36 out of 45 widened by an average of +5.85 bp. (2026): 4 out of 13 widened +6.27 bp.
· Remaining Longs (2025): 14 positions tightened by -1.53 bp. (2026): 10 positions widened by +1.64 bp.
· Remaining Shorts (2025): 9 positions tightened by -19.23 bp. (2026): 10 positions widened by +2.72 bp.
· Average Spread Movement (2025): ±6.73 bp in the recommended direction. (2026): ±2.74 bp.
· Success Rate (2025): 88.2% of indicators reached avoid-trading levels (slightly below historic norms).
· Average Trade Holding Period (2025): 23.7 days (above average).
Systematic Portfolio Daily Equity Trading Model
· Long Indicators: Target G-255 issuers with positive year-on-year cash flow, trading more than 7.5% below their moving averages. Focus on issuers with the largest capital returns to shareholders.
· Short Indicators: Target G-255 issuers with negative year-on-year cash flow and returns to shareholders, trading more than 7.5% above their historic moving averages. Focus on issuers with the largest declines in operating cash flow.
· Trading levels for all 242 equities determine the number of positions: G-255 is not a "stock picking" tool—it is a stochastic measurement system based on current operating metrics and returns to shareholders.
· Current Status of Trading Indicators: Last week, one short trade and 2 long trades were added, while 2 long indicators reached their avoid trading levels.
2
G-255 Specific Equity Trading Indicators February 17
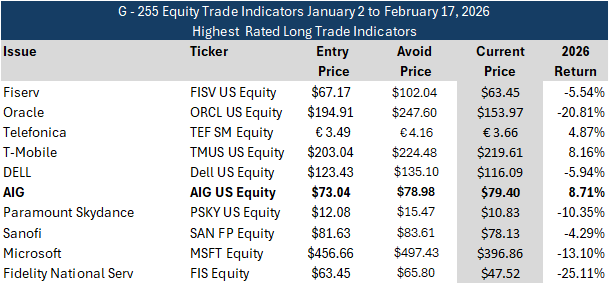
· Open Long Positions: since January 5, the G-255 has added and (subtracted) 30 issuers from the most attractive long indicators list. In February: 2/4/26, Abbott Labs (ABT), 2/5/26, Prudential Financial (PRU), NVIDIA (NVDA) 2/08/26 Amazon (AMZN), 2/9/26 Marsh & McLennan (MRSH), 2/11/26 IBM (IBM) were added.
· Closed Long Positions: Since January 20, 10 the G-255 Highest rated Long Trade Indicators have reached their avoid trading levels. In February Marathon Pete (MPC), Mondelez (MDLZ) on 2/3/26. Kroger (KR) on 2/5/26, NVIDIA (NVDA) on 2/6/26. Charter Communications (CHTR), Diageo (DGE LN) 2/11/26 . Softbank (9984 JP) and Kraft Heinz (KHC) all reached their fair value trading level. AIG US Equity reached its fair value trading level 2/17/26.
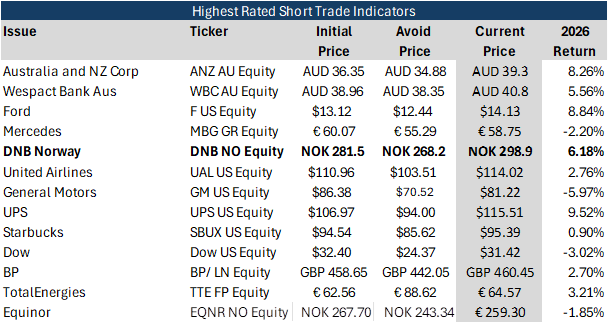
· Open Short Positions: G-255 Highest short indicators added UAL US equity 1/20/26, GM US equity and UPS US on 1/27/26, Starbucks (SBUX) on 1/28/26 and Dow (DOW) on February 6, BP (BP LN) and Total Energies (TTE FP) added to the highest rated short trade indicator list
· Close Short Positions: On January 30 Nordea Bank NDA SS Equity was changed to a G-255 long trade indicator post 4Q earnings.
Equity Trade Definitions:
· A G-255 "Highest rated" equity long must be trading -7.5% relative to its historic moving average.
· A G-255 "Highest rated" equity short must be trading +7.5% relative to its historic moving average.
Overall, the 31 highest-rated G-255 long positions have returned 5.10% in January and +-.35% in February
Overall, the 7 highest-rated G-255 short positions have returned -1.85% in January and +.79% in February
G-255 Trade Sizes and Systematic Trade Process for Corporate bonds and Equities
· G-255 represents the world's 255 largest issuers of corporate securities and have a minimum equivalent of $15 billion of tradable liquid debt market capital in all global currencies.
· At present there are 6,055 G-255 USD bonds in circulation.
· There are 242 publicly listed equities for the G-255 debt issuers that trade in 8 currencies.
· The total equity market capital of the 242 stocks is just over $47 trillion or $182 billion per issuer. That is 60% larger equity capital per constituent than the S&P 500.
· 80 of the 242 publicly traded equities for the G-255 are domiciled outside of the United States.
3
G-255 Credit Indicators USD Trading Process and Size – Overall Strategy Is Designed To Trade $3 Trillion of Assets
· The G-255 trading process is designed for systematic trading on electronic platforms for equities and bonds.
· The system accommodates the largest institutional trade sizes, dependent on user resources and trading relationships (all G-255 USD corporate bonds trade OTC via over 80 dealers and all 5 major U.S. electronic bond trading firms).
G-255 Credit Indicators and USD Liquidity - 80% of All Daily TRACE Trades
The G-255 credit trading indicators cover 80% of daily NASD TRACE trades (95% of USD investment-grade and 48% of USD non-investment-grade).
G-255 Trade Indicators are created daily for all 6,250 debt and equity securities.
· Indicator Calibration: The stochastic credit trading model uses earnings data to recalibrate balance sheet leverage and valuation indicators, then evaluates spread-to-curve positioning, earnings momentum, and debt ratios against each issuer's historical trading patterns.
· Bond-Level Granularity: G-255 USD issuers hold an average of 27 USD bonds outstanding (~$27.5 billion USD debt cap per issuer). The model analyzes historical relative value across the capital structure, generating indicators for over/undervalued bonds.
· Equity-Credit Linkage: For issuers with both equity and bonds, equity signals (driven by cash flow and shareholder returns) directly influence credit spreads. The framework integrates these to produce synchronized long/short signals based on liquidity thresholds.
Equity and Credit Trading and Sector Indicators and Tuesday Trading
Tuesday, February 17, 2026, Post-President's Day weekend and mid-term break week resulted in 10–20% lower trading volumes across most risk markets. The G-255 new supply machine continued unabated, with Amgen (AMGN), Barclays (BARC LN), and PG&E contributing to approximately $9 billion in additional new issuance. Despite this, G-255 credit spreads and equities remained largely unchanged.
Tuesday marked the first day since January 15 with no significant headline or trading impact from reported earnings on G-255 risk assets. BHP delivered strong 1H results, while Medtronic and Energy Transfer reported earnings increases for their most recent quarters. However, cash flow, shareholder returns, and balance sheet metrics were either unimproved or not meaningfully detailed.
Although headlines have focused heavily on "AI displacement" across global risk (equity and corporate debt) markets, the dominant market bet remains a series of U.S. Federal Reserve rate cuts in at least 3 of the next 5 FOMC meetings (through September 16, 2026). The 2–5 year U.S. Treasury curve now trades below the current upper bound of the Fed's 3.5%–3.75% overnight target range. The prevailing trade anticipates that, under incoming Fed Chair Kevin Warsh (nominated January 30, 2026, with Powell's term ending in May), the policy of maintaining the overnight rate +100bp above inflation will shift, potentially enabling further easing.
From a systematic trading viewpoint, momentum in U.S. assets continues to support both equity and debt prices. However, U.S. G-255 new issue bonds (263 bonds totaling $262 billion sold in just 6 weeks) are now underperforming most global risk markets on a credit spread basis.
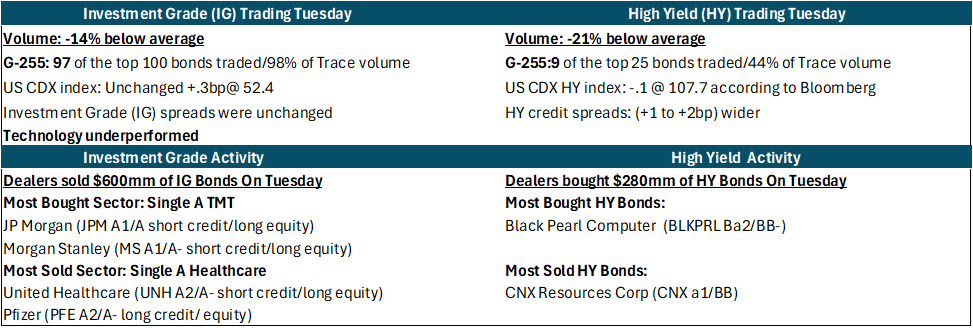
G-255 equities are now less overvalued than last Wednesday but remain near the highest levels since March 2020. Credit spreads remain unchanged despite positive corporate bond ETF inflows and >$4 billion in mutual fund cash flows last week—widening was especially pronounced on Friday while U.S. equity indices were flat.
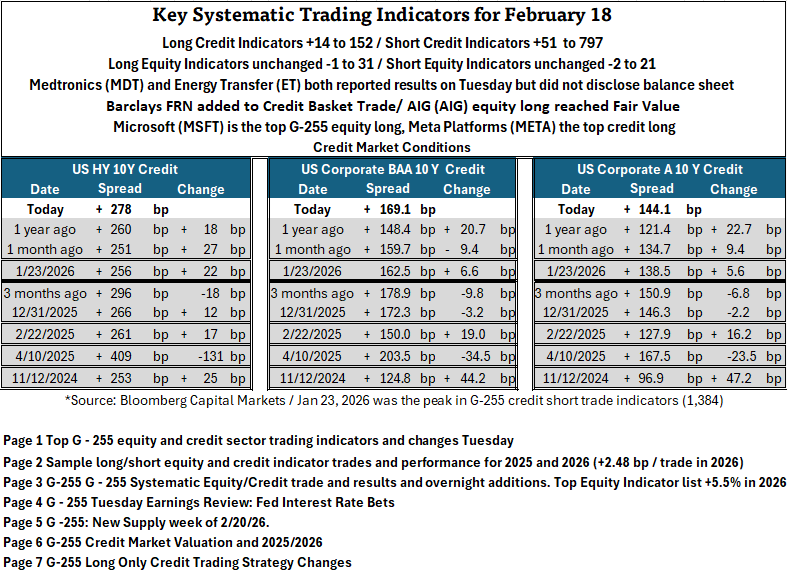
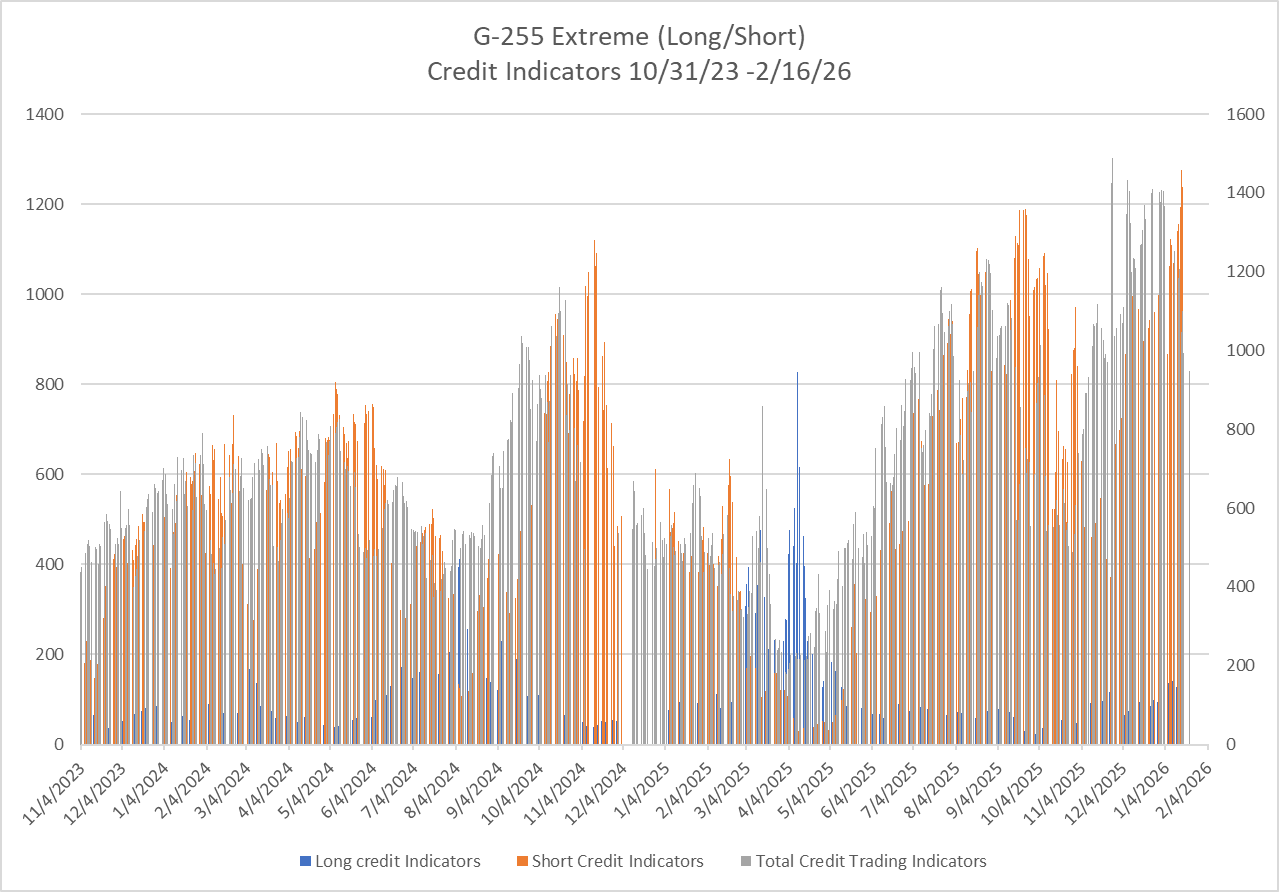
G-255 credit spreads are materially wider since the short credit indicator hit a 7½-year high of 1,384 on January 23, 2026.
4
G-255 Systematic Model Update: February 17 Trading and This Week's Earnings Reports
G-255 Credit Market Valuation and New G – 255 Supply February 17, 2026
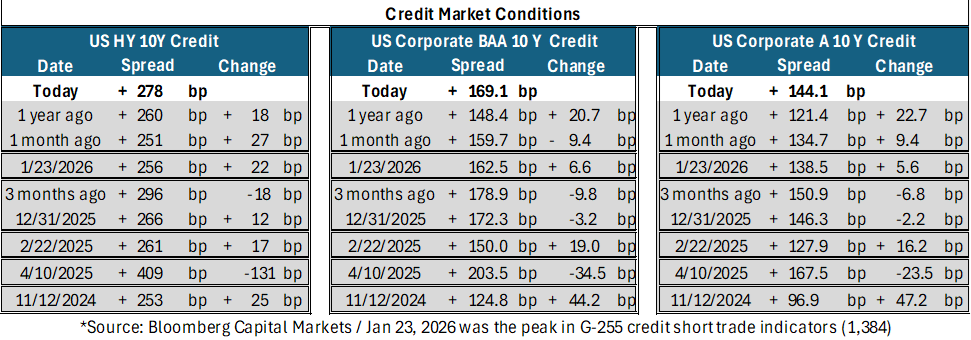
On a Risk/Reward basis, High Yield bonds have far outperformed Investment Grade in 2025 and 2026
· US Credit Spreads reached their tightest point of 2025, February 21, 2025, and widest April 10, 2025.
· US Credit Spreads reached their tightest point of 2024, November 12, 2024, and widest August 2, 2024.
The G-255 credit trading total short and long indicators peaked on the tightest and widest dates described above.
February new G-255 supply credit indicators
3 more G-255 issuer came to market on Tuesday, 2 of which are de-levering (Amgen and Barclays). The 3 new offerings were priced less aggressively (according to the G-255 credit trading) model than most deals priced in 2026.
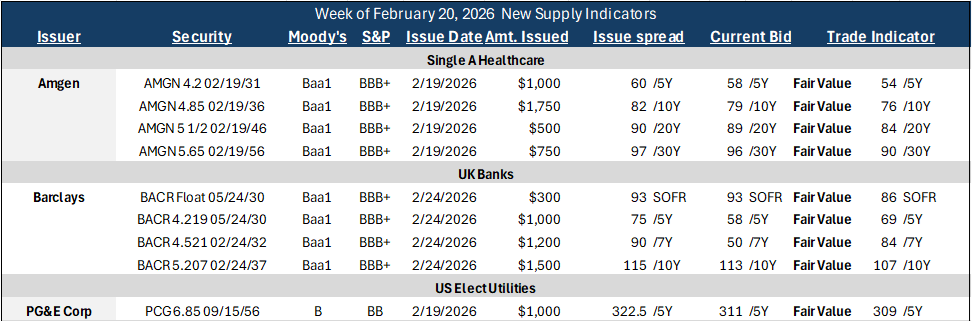
Through last Friday, February new G-255 supply has underperformed historic results both from a hedged or unhedged for interest rate risk standpoint.

The G-255 systematic model provides trade indicators only for the 255 largest corporate debt issuers. It generates long indicators for approximately 12% of new issues (representing roughly 67% of total annual USD new debt capital). Please see the weekly G-255 new supply report for details and results from 2025 and 2026.
5
G-255 Credit and Equity Market Indicators February 18
· Attractive Long Credit Indicators: 152 (+14 from Tuesday) and +50 % above the 200-day moving average of all long indicators.
· Attractive Long Credit Market Cap accounts for: 61% of all undervalued Systematic credit capital.

· Attractive Short Credit Indicators 797 (+51 from Tuesday and +30% above the 200-day moving average of all model short trade indicators). Short Credit Market Cap comprises 49% of all overvalued Systematic credit capital.
G-255 Equity Trade Indicators and US Equity Correlation to Overall US Credit Spreads
G-255 credit spreads have correlated directionally with US equity index movement for 24 of the first 31 trading days of 2026. Credit spreads and US equities were unchanged Tuesday

US equities are -1% over the past month; US credit spreads are now wider as well.
Systematic Equity Trading Indicators February 17
• Attractive Long G-255 Equity Trade Indicators: 31 (including both undervalued and equities priced at extreme discount) -1 from Tuesday and -59% below the 200-day moving average of all long-trade indicators.

• Short Equity Trade Indicators 17, (-2 Tuesday) and +66% above the 200-day moving average of all model short trade indicators).
G-255 Key Differentiator
G-255 equities represent 84% of the world's daily large-cap trading volume, while its credit coverage includes ~85% of daily TRACE-reported USD corporate bond trades (95% IG, 48% HY). The model delivers back-tested tracking accuracy of 97.5% by isolating each issuer against its own historic norms—enabling precise detection of extreme valuation levels that broader benchmarks often miss.
6
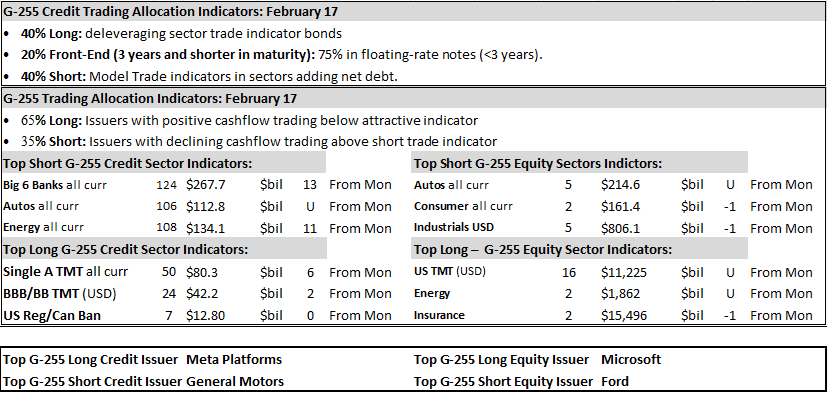
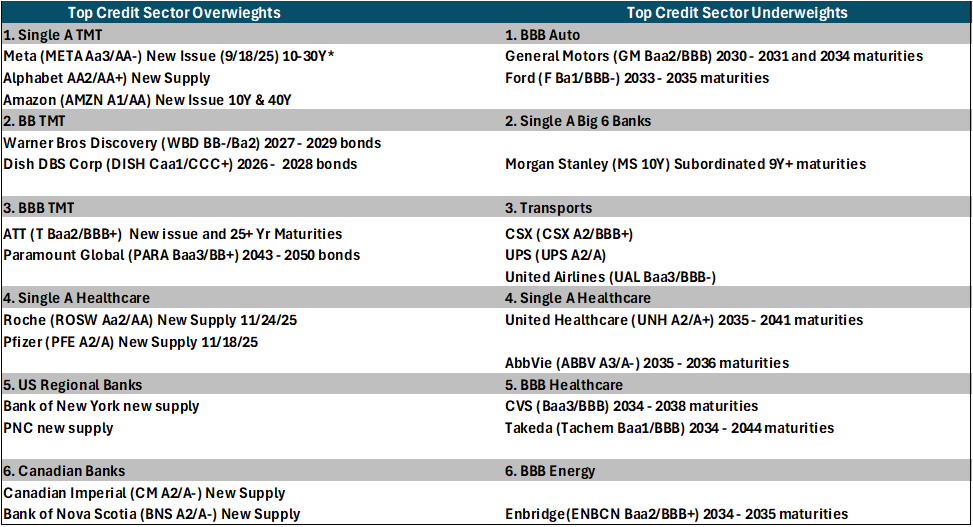
G-255 Credit and Sector Indicators for "Long Only" trading strategies February 18
7
Disclaimer - This report is not intended as, and does not constitute an offer, or a solicitation to buy or sell any securities or financial instruments. All data, levels, opinions, and representations herein are provided for informational purposes only and should not be relied upon for making investment decisions. Past performance is not indicative of future results. The authors of this report assume no liability for losses or damages arising from the use of this information. Investors should consult with a qualified financial advisor before making any investment decisions. The information in this report is based on sources believed to be reliable, but no guarantee is made as to its accuracy, completeness, or timeliness.